
Time for the yearly tracking post! I’m making some changes to my spreadsheet of doom this year, so it’s time to document that.
Overview
So, hi! I am continuing to be a busy person. The actual reason for a lot of this tracking is managing chronic health foo, and figuring out if I’m starting to see something flare (or cause more issues) so I can do something about that fast.
And then I also want to keep an eye on what I’m getting done (and not getting done), so I can make progress on the stuff I care about.
What I do
- Day job as a research librarian: Right now I’m in the office two or three days a week (I alternate Mondays with the other person in the office.)
- A lot of writing and self-publishing: This involves both making new words happen, but also a bunch of writing admin, publishing steps, documentation, etc. New this year: more tracking for the admin stuff.
- Priestess of a small religious witchcraft coven: I want to keep track both of stuff in my own personal practice and of the time spent on group stuff and some other community pieces.
- Embodied life stuff: Various health markers (explained when we get there), if there’s been unusual strain on my body, etc. Also just plain household maintenance stuff like cleaning and cooking.
- Time with friends, on hobbies, other small projects. Like you do.
Read on for (a lot) more details and images.
General notes
I start my yearly tracking on the winter solstice (December 21st) and this affects a couple of calculations that I’ll explain when they show up.
This is all done in Google Sheets (because I want to be able to access it when I’m in the office, and from multiple computers.) I do most of the data entry at night, before I start writing.
Not shown in the images below: I also have a sheet that does all the data validation information, and another that does score totals for the things where that’s relevant each year. I am planning to adjust my scoring a bit this year, because I’m trying to differentiate better between “input of info that’s useful to me” and “pointless puttering at a screen”. Sometimes that second one needs to happen, but I want to track it differently.
Images come from a variety of Etsy clip art sources. (You can insert images in Google Sheets via the edit menu -> Insert image). This year, I saved smaller versions of the ones I wanted to use (300×300) to reduce the file sizes and the overall load from the sheet.
These are only part of my tracking system. The other parts include:
- Todoist for my project and task tracking.
- Obsidian.md for daily notes and record keeping of a bunch of things (I also have separate vaults – collections of files – for my private authorial wiki, books I own and want to read, my religious and spiritual notes and projects, and my writing research.)
- Project management that’s currently a riff between a couple of systems, specifically Sarra Cannon’s HB90 and Rachael Stephen’s Constellation Clarity.
- ATracker app for time tracking on a daily level.
Images: I’m describing the screenshots in the text that follows the image (the alt-text covers the overall image + design). Click on the image to see it bigger.
How I use the individual sheets: Normally, I filter so I see only a month at a time (or on the log sheets, hide previous entries once I start a new month). This fits all on one screen on my usual devices and makes everything easy to see.
How long does this take me? Tracking some of this through the day takes me maybe 5 or 10 minutes (mostly the time tracker). It takes me 5-10 minutes at the end of the day to log the info from the various phone apps into the sheet and make any notes. (Setting up the sheet every year takes me about 4 hours, but then it’s ready to go for the entire year.)
Changes this year
I want to improve my reading (both how much, and how I’m spreading it out between writing-related research and reading for pleasure). Since I know I’m a lot better about doing stuff I track, I got a lot better about granular tracking for the reading (and it’s all in the same sheet, which just lives open on a tab in my browser, so it’s always available.)
More granular tracking for writing admin: I’ll talk about that when we get to those sheets. (My tracking for word count has been pretty steady for a few years)
A bunch of aesthetic changes to simplify, do something a little visually different, etc. I tend to be very responsive to (and sometimes picky about) colour choices even though I’m not otherwise a visual-focused person in a lot of ways.
Overview
The first sheet is an overview. I’m still considering whether I want to add other info to this one, but I can do that easily as I want to.
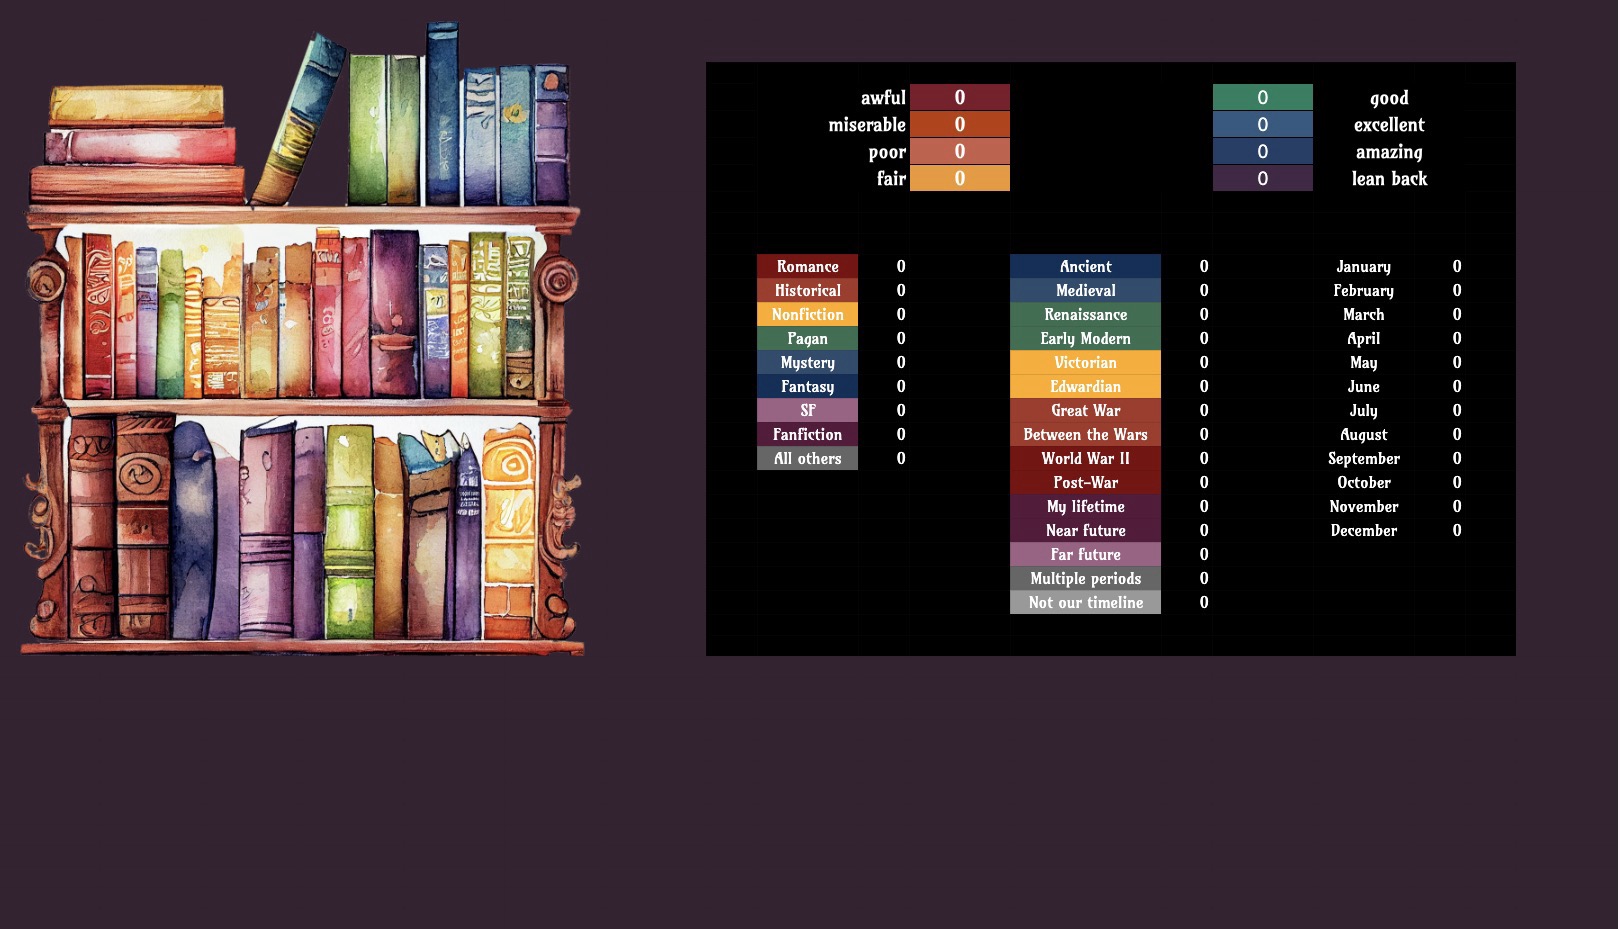
What we’ve got here are two sets of data.
The top set – two columns of four items each – give an overview of that day for me, based on some calculations of data on other sheets. These include how much I got done and how my body was doing.
I want my days to mostly fit into the good, excellent, or amazing categories. The last on the right, “lean back” is a sign of “you did a whole lot today, maybe don’t do quite so much tomorrow” because that way lies exhaustion and burnout.
The other four – awful, miserable, poor, and fair – I want to avoid, but they allow some gradations from “absolutely not able to get things done” to “sick and not doing much but not completely awful”. If I start dipping into “fair”, it’s usually a sign of a chronic illness flare, and taking steps to stop that early help a lot.
The bottom columns are a summary of my reading. This is front and centre because I want to improve that this year. The left column calculates by genre, the centre one by time period, and the right column by month. My timeframes are broken up the way they are because I write between the 1880s and 1940s right now, and the research reading can get pretty granular in terms of period (and I want to be able to see that breakdown).
Summary
Here’s my summary page day by day.
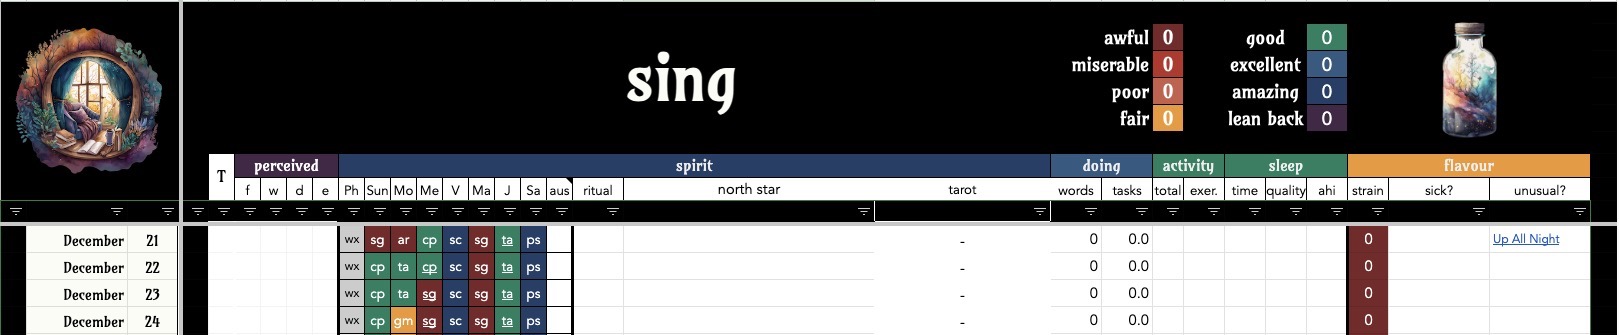
It gives me an overview of the day. At the top, we have the summary of total days in each category (same as the Overview page above).
Left to right, here are the columns:
- T is the total for the day, which is colour coded to match the quality of the day.
- Perceived is how I felt about the day on a 1 to 5 scale – how was my focus, how much willpower did I feel I have, how did I feel about emotional stuff, and how did my body feel. Most of the time I put in 4s for these, but it allows me to track not-great days and which way they were not-great.
- The next set of columns track the lunar cycle (under Ph) and then the astrology of the day, so I can see influences or changes at a glance.
- Ritual notes how many ritual things I did. Most days it’s one (my morning devotional practice), but sometimes it can be good bit higher. (This counts distinct items, not total time. Total time is elsewhere.)
- Doing is a summary of the total number of points from the Doing sheet (see the next item below), and the word count for the day.
- Activity is how much general movement I did, how much actual exercise, how much I slept, quality of sleep (from my sleep tracker) and ahi, which is how many times I stopped breathing per hour (from my CPAP machine).
- Strain adds up things that are more of a strain on my body, so I can see the impact.
- Flavour has items for sick days or unusual, so I can see if there’s an obvious big reason that my numbers are weird that day.
Body
This one tracks a bunch of physical data so I can see patterns (and as needed, give it to my medical professionals, who tend to go “Wow, that’s a useful amount of data.”)
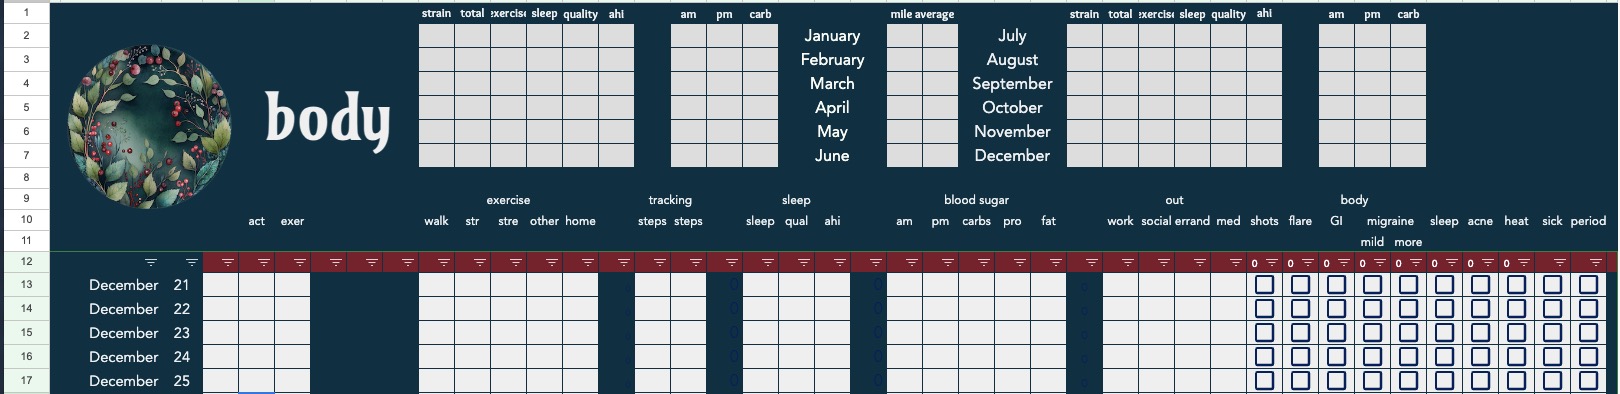
Without getting too into the weeds with the details, here we have:
- Summaries for a bunch of categories for each month at the top, so I can see month to month changes at a glance.
- Physical activity and exercise
- Strain: There’s no data for this one yet, so you can’t see it, but that middle green column after the activity counts strain to my body – it counts up the number of blood sugar readings outside of my goals, plus the checkboxes ticked, so I can see how many things are not working quite right for me physically that day. (I usually average somewhere between 1 and 2, but if things spike, I want it to alert me.) It uses conditional formatting with colour coding.
- What kind of exercise – some things I do don’t get picked up well by the tracking app in my phone, so I want a way to track that. “Home” is for time spent doing chores at home with my phone sitting on a counter.
- Steps, both the step count from my pedometer app, and a translation into miles.
- Blood sugar tracking: fasting reading and after dinner, plus macronutrient counts (I use a food tracker. I resent this, but it’s currently necessary.)
- Out: did I leave the house? Leaving the house is unduly exhausting out of proportion to the time involved for me. Work is my commute, social is social time that involves going somewhere, errands are errands, and med is medical appointments. It gets a number based on the time involved in the travel.
- A series of checkboxes for specific symptoms that I want to keep an eye on. Shots is my allergy shots, which are great, but also mean my immune system sometimes would like to gripe at me. I’m currently in that ambiguous perimenopause/menopause zone, which explains a couple of the others. (I also track symptoms with more nuance in an app called Bearable, this is just the high level “did this bug me today”)
Doing
This gets a lot more granular about what I did that day (I track in ATracker, my time tracking app, during the day, and transfer it in the evening.)
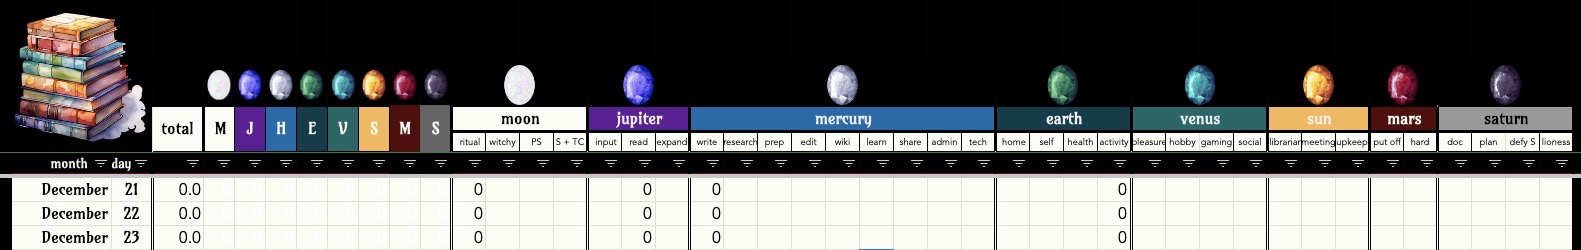
I group things in my life related to the planet (in the astrological sense, where each planet is associated with specific concepts, tasks, or areas of life. I’m just doing the visible planets plus earth here.) It lets me see the balance between the parts of my life in a very concrete way. They’re in order based on colour, because I find that more visually pleasing.
At the left, we have an overall total and then a total for each planet.
Moon: Religious stuff. It pulls in the total for ritual time from my Spirit sheet, and then I have categories for personal practice (“witchy”), coven (“PS”), and other community spaces (“S & TC”).
Jupiter: Reading and learning. Input is ‘reading stuff on blogs or listening to podcasts’, Read is active reading in books, and Expand is courses that don’t fall into the Writing info.
Writing tracks different writing activities. It pulls in word count from that sheet. Then we have research, prep, edit, wiki, learn, share, admin, and tech.
- Prep is things like outlining or time sorting out a timeline.
- Wiki is putting things into either my personal wiki or the public one.
- Share is publishing related tasks and newsletter and social media posts.
- Admin is other random admin.
- Tech is for updates, learning new software, troubleshooting, and all the other things of a modern age.
Earth is for various household and embodied life things. Home is household chores and cooking. Self is things related to me. Health is doctor’s appointments, picking up prescriptions, etc. And then it pulls in the activity total.
Venus is for pleasure, hobbies, gaming, and social time with friends.
Sun is for the day job. Librarian covers library duties (reference, projects, etc.), meetings are self-explanatory, and upkeep is for some ongoing slogs of projects in our catalog cleanup. (I want to see if I’ve made steady progress on these, but I can’t manage a lot on any given day.)
Mars is for challenges: I give myself a suitable number here if something was extra hard to do (but I did it) or if I’d been putting it off for ages and got it done.
Saturn is for planning and structure. I track documentation time, planning, “defy entropy” which is things like filing digital files in the right place or doing upkeep on notes, and “lioness’ is an ongoing data wrangling project I do for a friend.
Spirit
This is where I track daily devotion notes and what I did on the religious front.
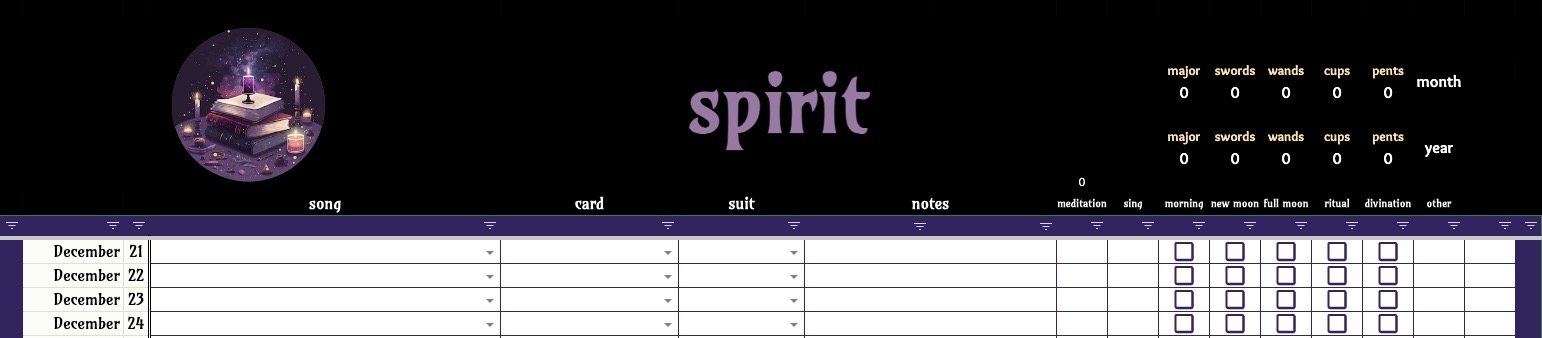
Here, I track the song of the day (from a series of playlists), my Tarot card pull of the day, and then if I did any meditation, if I did my ritual singing, and what ritual things I did.
The categories for those are morning (daily practice, which takes me under 5 minutes), new moon, full moon, ritual (other rituals), divination (outside of the previous options), or other. The amount of time these take is calculated under the Doing sheet, this is just “did I do a thing”.
Words
Here’s where we get into my writing sheets. The first is an overview sheet, and it pulls data from several other sheets.
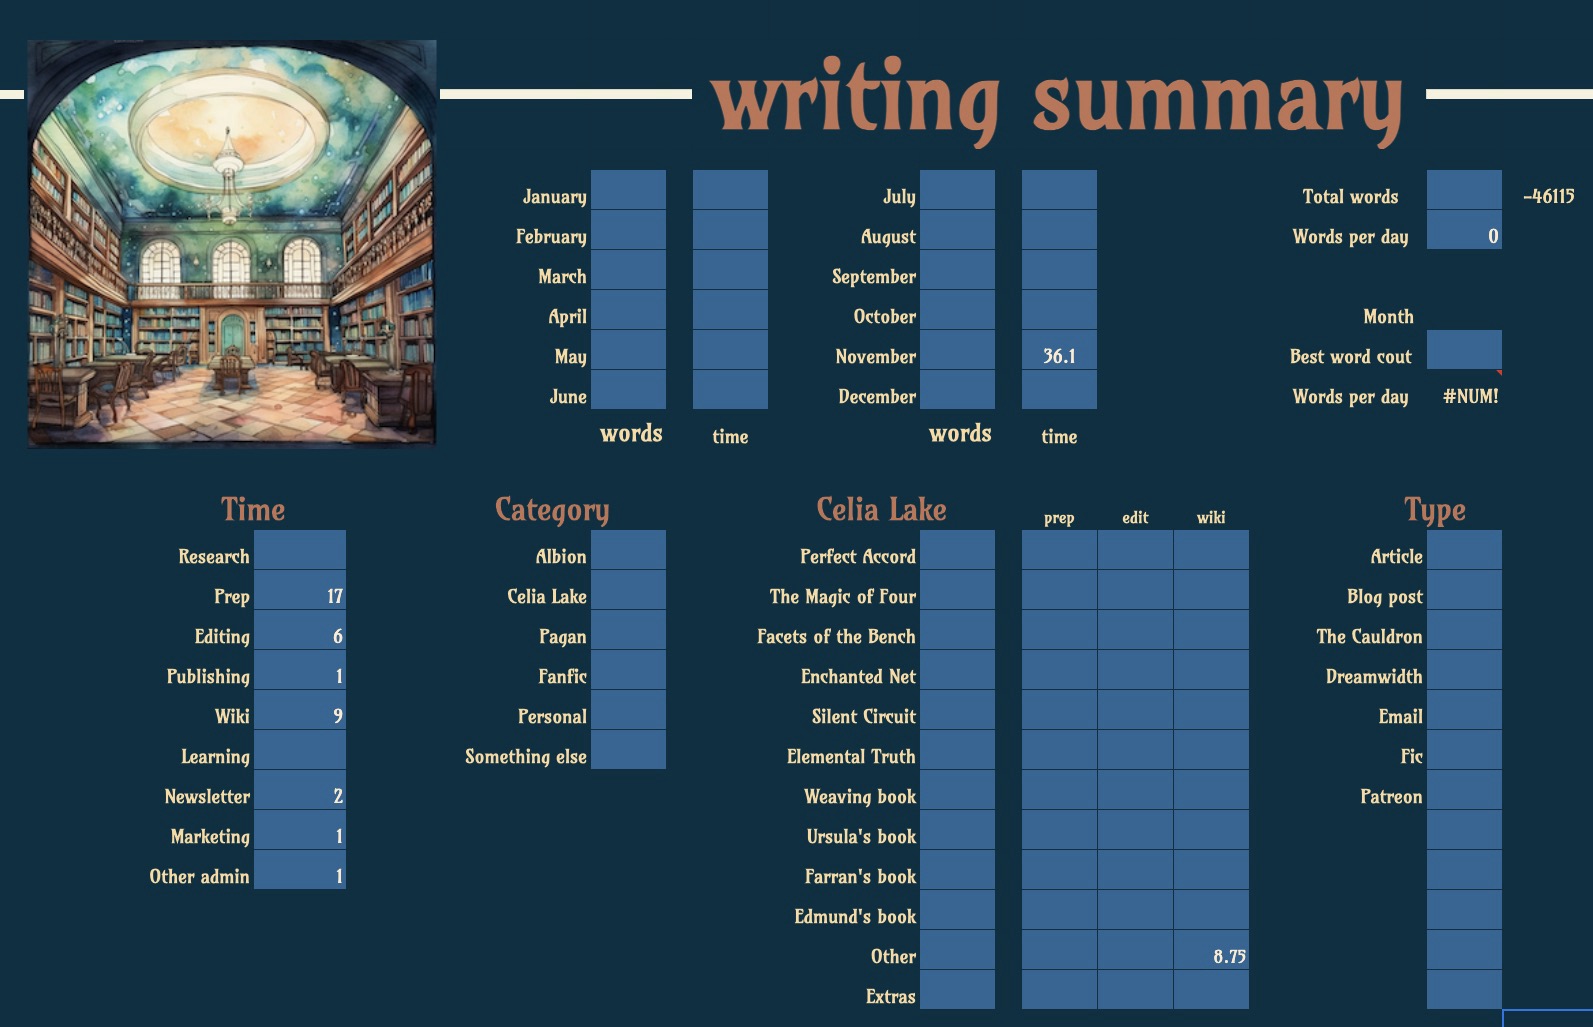
At the top are columns for each month, with totals for words and time. There’s a total for words (the number to the right is because I do a yearly writing challenge, and I need to subtract the words from December 21st to 31st from that reporting.)
Then I have a breakdown of time by category. These are the same as on my Doing sheet, though I’ve broken out “Sharing” into Newsletter and Marketing.
The category is the writing project. Albion is my fiction writing, then there’s a category for all the other stuff in that mode (blog posts, Patreon posts, etc.) Pagan and fanfic are probably obvious. Personal writing is long-form posts on Dreamwidth, emails, or potentially here. Something else is my junk drawer.
Then under we have a set of things by project – both word count and new this year, other time I spent. These pull from the writing activity sheet. I’ve been testing this in a separate sheet this quarter, and I’m going to pull in that data for the relevant projects into the 2024 sheet (which is why you can see some numbers already.) My goal is to see how much prep time, editing time, etc. is involved for each book.
(The first three items on that list exist in complete drafts, or will by tomorrow, so they’re going to get editing and wiki time in 2024, but not much writing.)
Finally, there’s a category for the type of writing when it’s not those projects.
Writing – day
This sheet is my summary by project for each day.
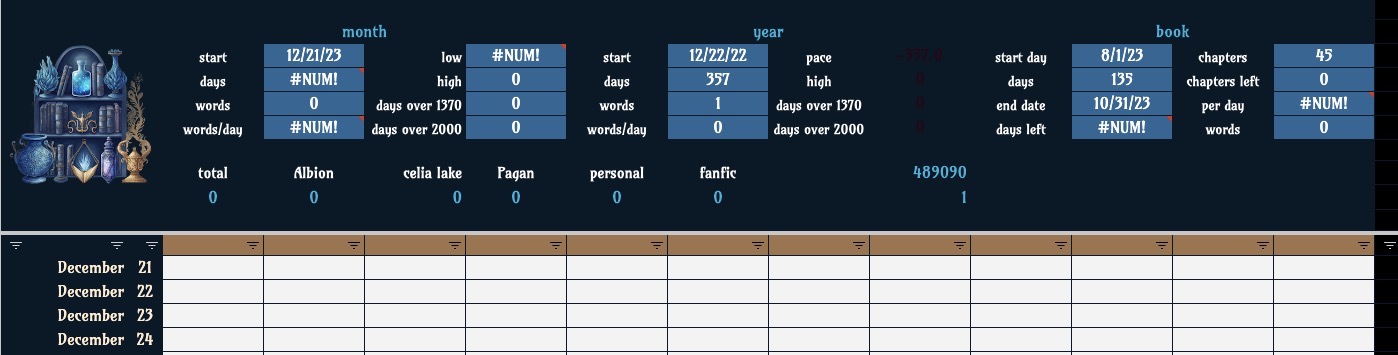
This sheet pulls from the Writing – Log sheet and gives me a total wordcount for the day (if I write several things), totals by project, and then some stats based on pace. I have words total for the month, words per day, my lowest word count that month, my highest, and then how many days over 1370 (baseline for one of my community goals) and 2000 (where I prefer to hit).
I then have those same totals for the year.
Finally, there’s stats for that book – how many days I have left to work on it, how many chapters I’ve written, how many chapters I have left to go, and the total word count so far.
Writing – log
Here’s the log sheet for each individual bit of writing.
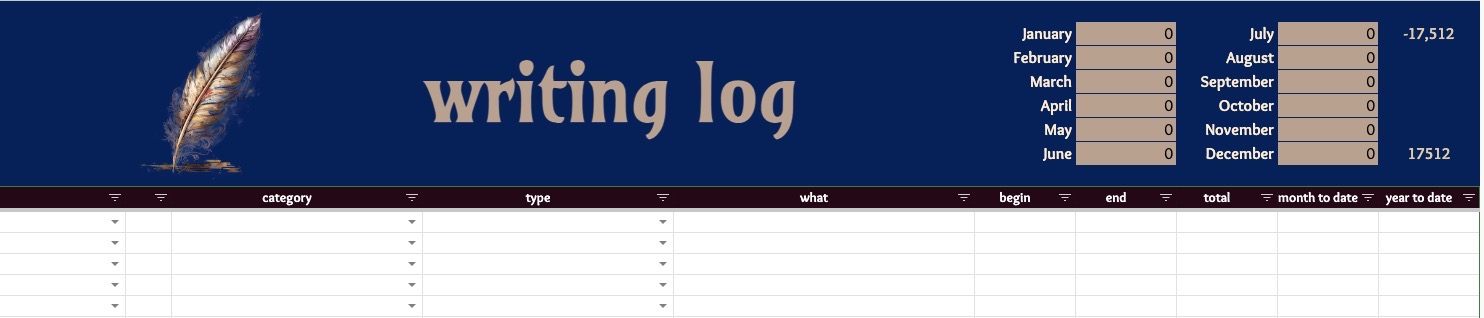
The left two columns are the month and date (allowing me to pull all the entries related to December, for example). Then we have the category of the project, the type of writing, what I actually wrote. “Begin” and “End” give me the start and end numbers for that chunk of writing (if I start in the middle of a chapter, for example). Then we have the total words, the month to date, and year to date.
All of the projects have data validation to the previous Words sheet, so I don’t have to type it all out all the time, and to avoid typos messing up the data.
Writing – activity
This is one of the new sheets this year, more granular tracking of writing activity that isn’t making new words.
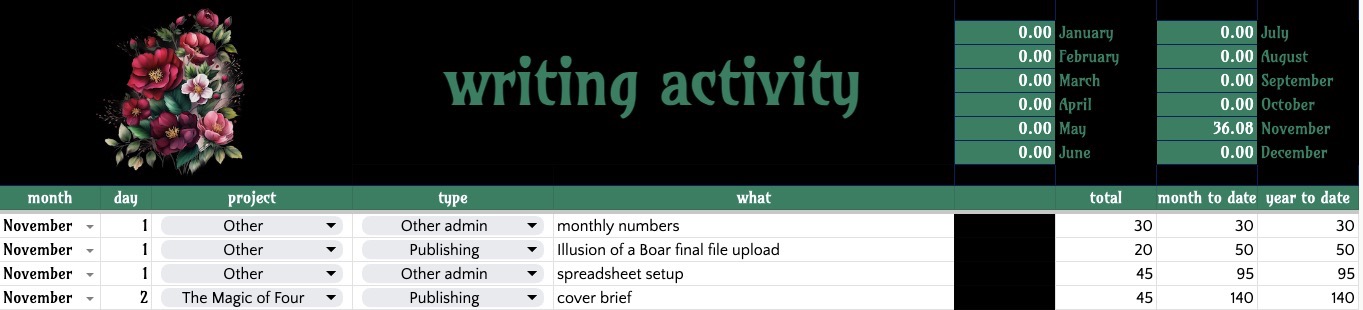
Here you can see some actual data, since I’m pulling in some of this into the 2024 sheet. Again, I have month and day so it can get assigned to the right totals. Then I select the project (again validated to the list of projects in the Words sheet), what kind of activity it was, what I did, how many minutes I spent on it, and month and year totals.
Doing this logging as an individual line lets me include it in other sheets in different ways (so I can track both “how much time did I spend sending my newsletter this year?” and “How much prep time went into each book?”
Reading time
Here I log what I read and when.
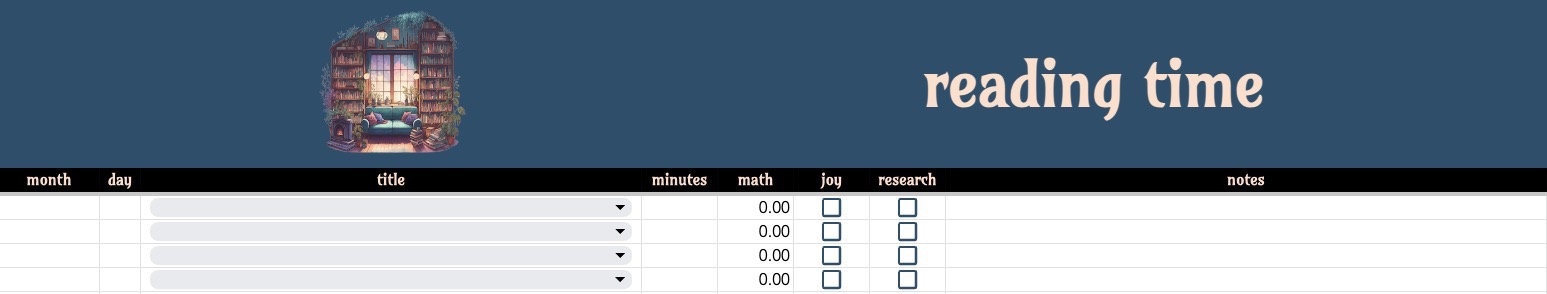
We have month, date, and then title (which validates based on the next sheet, Books Read), how many minutes, what that translates into in terms of a decimal, and then whether I was reading for pleasure or research (or both!). There’s also a space for notes.
Books read
Here’s the list of titles I read.
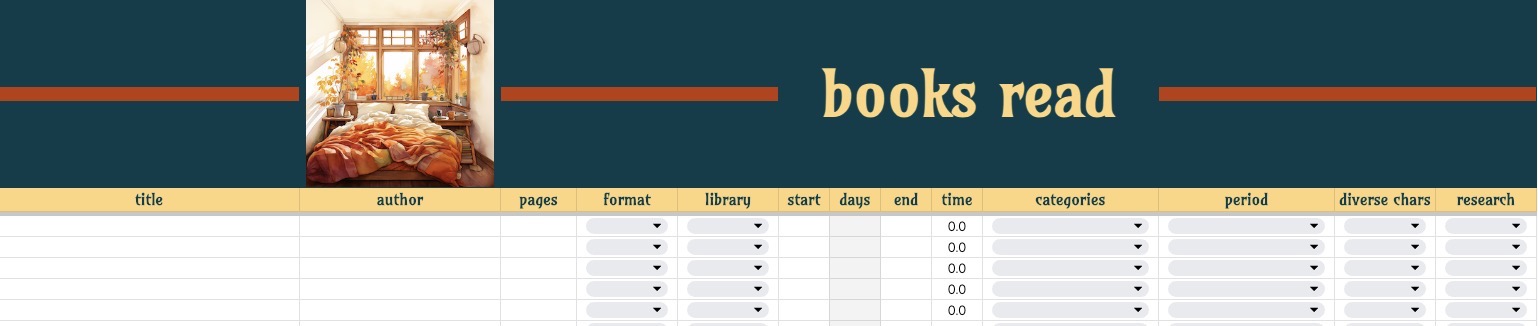
Here we have columns for various things:
- Title and author are self-explanatory
- How many pages
- Format (ebook, print, etc)
- Whether I got it from the library (so I shouldn’t go look in my own collection for it.)
- When I started, how long it took me to finish, and when I finished.
- How much time I spent reading (pulling from the reading log sheet)
- What category it falls in (genre or topic), what period of time it covers (the primary one, since I can only select one), whether it has diverse characters, or whether I read it for research.
Reading charts
Finally, here we have reading charts – there’s no data here so it doesn’t look like much yet.
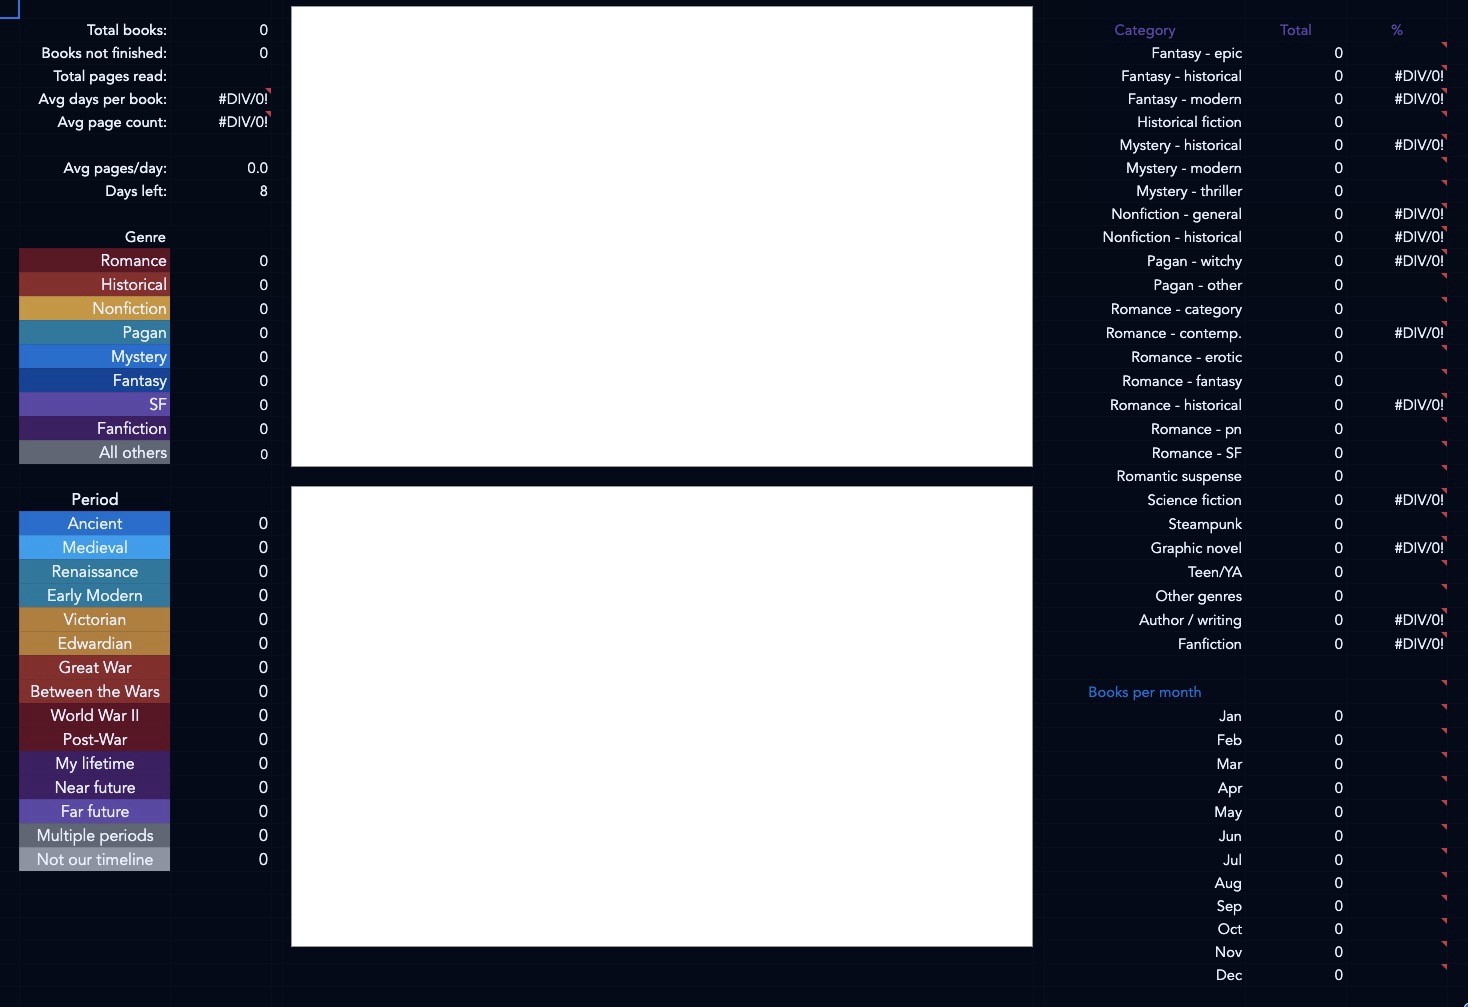
This pulls all the reading data into one place.
Some statistics: total books, books not finished, total pages read, average days per book, average page count, pages per day, and days left in the year.
Totals by genre: Based on my likely reading. These draw from the “Category” lists on the right, which are more nuanced, and combine in different ways. For example, “Romance” includes all the romance categories, but “Historical” includes Fantasy – historical, Historical fiction, Mystery – historical, etc.
Period breaks this down by time period. As noted earlier, I’m a lot more granular in the periods relevant to my writing. In 2024, I expect a bunch of Victorian reading and a bunch of World War 2 and Post-War, because I’m getting into the late 40s with one series. (Post-war covers 1945 to 1975, when I was born.)
Category is a lot more nuanced about the main genre or subgenre of the book. And finally, Books per month is self-explanatory. The right hand column on the last two is a percentage of total books.
There we go! So much data, but I do find it useful.


